Hello and welcome to the second part of our series covering simple trading strategies using Bollinger Bands. In the previous article, we covered the basics of Bollinger Bands and how they can be used in trading. We also discussed a simple yet effective trading strategy that made use of Bollinger Bands to maximise profits and minimise risk.
Here we will cover two more strategies that you can use to further enhance your trading experience.
Strategy 1: Buy the `W’ and sell the `M’
This is a very simple and effective pattern involving four key criteria. With a little market acumen, one can reduce that to three, improving the chances of a better entry.
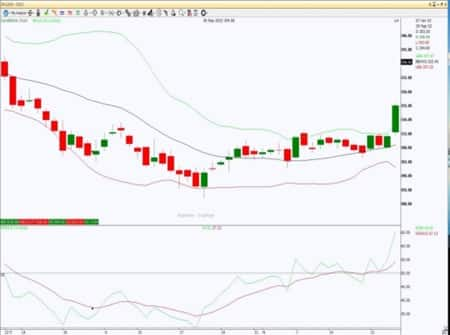
1) Wait for a reaction low to form. Usually, this can be observed when securities are falling relentlessly. The reaction low is usually below the lower Bollinger Band.
2) Observe the price bouncing to the middle band (the mean or the 20-day moving average). This is usually a dead cat bounce, without much potential. The important point to observe is that the price pauses at the middle band and resumes its downward movement;
3) There is a new price low in the security. This low holds above the lower band. The ability to hold above the lower band on the test shows less weakness on the last decline.
4) The pattern is confirmed with a strong move off the second low and a resistance break.
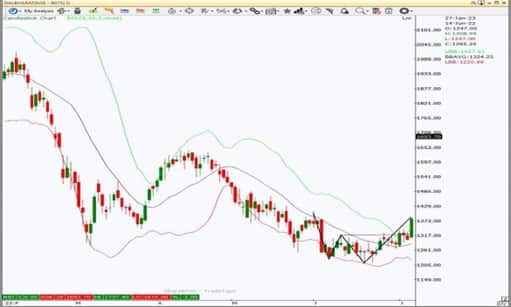
(A 'W' bottom)
Usually, the buy can be confirmed at the third step itself, based on the evidence of some bullish candles (as you can see in this picture). Because by the time the fourth step is confirmed, prices would have already rallied quite a bit. A professional trader would ideally use the resistance break to add to his existing Buy position(s), i.e., Scale In.
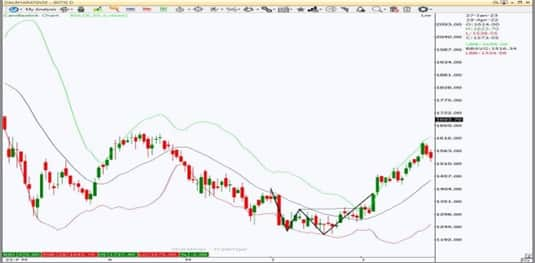
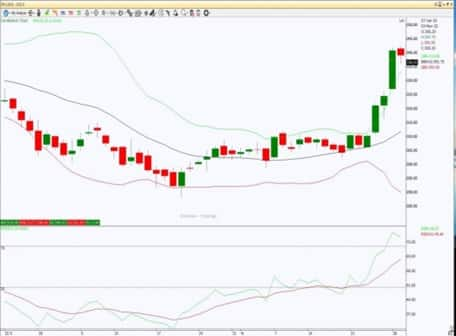
Post the 'W' confirmation, you can see the prices rally handsomely (picture below). How one can capitalise on these big moves post the `W‘ confirmation is beyond the scope of this discussion. Maybe we’ll have a separate piece on trade management.
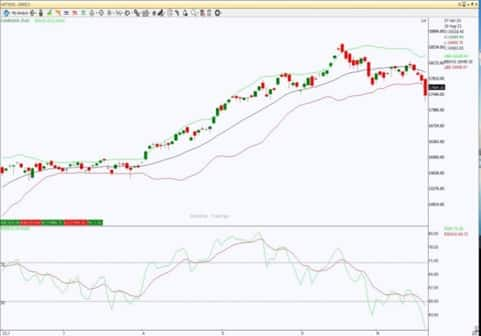
The same steps can be followed in reverse for a short setup. Let's quickly review the steps for this:
1. Price is hitting a reaction high.
2. Price is coming down to the mean.
3. Price is making a new high (higher than the reaction high).
4. Price is breaking a support.
This is what the `M’ top would look like:
(M: top formation)
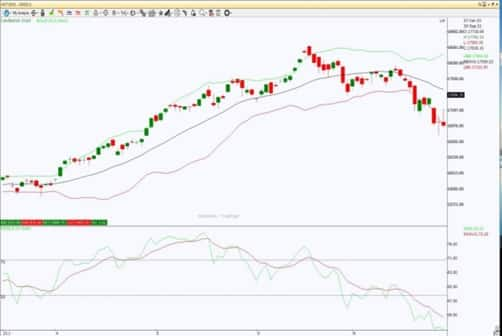
 (M: top outcome)
Although this strategy can be applied to any time-frame equally effectively, lower time-frames are likely to provide more signals, or more trade opportunities, and higher time-frames are likely to provide less signals and less trade opportunities. While intraday traders typically use 15 / 30 minutes for this strategy, swing traders would use 60 and 240 minutes, positional traders will use daily or weekly time-frames, and investors would use monthly time-frames.
Strategy 2: Walk the Band
Although there is an expectation that prices will revert to the mean after tagging the upper and lower bands, there are enough instances where prices are seen “hugging” the upper band on their way up and the lower band on their way down. This happens in the trending market, where John Bollinger suggests we Walk the Band.
That is the beauty of Bollinger Bands. For an astute trader, not only are they helpful in a sideways market, they are also very handy in a trending market. Just like the `M‘ and `W‘ pattern strategy, traders have a separate strategy for Walking the Band. The following filters can be used to execute the Walking the Band trading strategy:
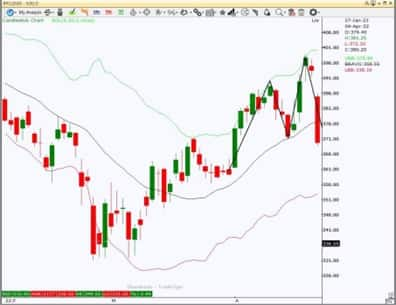
1) Observe the stock closing above / below the upper Bollinger Band by more than 50 percent with a strong green / red candle.
2) Use the Relative Strength Index (RSI) as an additional filter to gauge the strength. For beginners, an RSI level > 60 indicates a strong uptrend and an RSI of < 40 indicates a strong downtrend;
Note: ensure the RSI is not > 75 in an uptrend and < 25 in an downtrend, as you may end up buying in an overbought area and selling in an oversold area.
3) This combination of Bollinger Bands and RSI is a powerful way of riding the trend in the underlying instrument.
Here is what the Walking the Band strategy may look like:
Tag of the upper band and RSI > 60
(Tag of upper BB and RSI > 60)
(Tag of upper BB and RSI > 60 – the outcome)
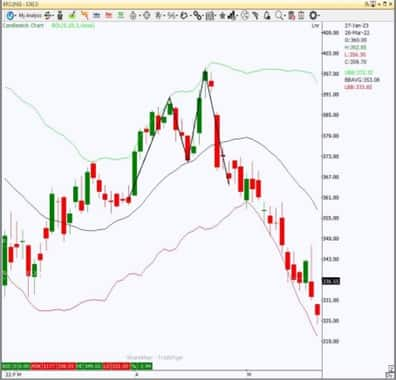
Tag of the lower Band and RSI < 40
 (Tag of Lower Band and RSI < 40)
 (Tag of lower band & RSI < 40 - the outcome)
In conclusion, Bollinger Bands are a valuable technical indicator that help traders make informed decisions. By combining the use of Bollinger Bands with simple yet effective trading strategies, such as the one we discussed today, traders can potentially increase their profits while minimising their risks.
Remember, there is no one-size-fits-all approach to trading and it's important to always do your own research, consult financial advisors, and use a strategy that aligns with your personal goals and risk tolerance.
Disclaimer: The views and investment tips expressed by investment experts on Moneycontrol.com are their own and not those of the website or its management. Moneycontrol.com advises users to check with certified experts before taking any investment decisions.

Check Free Credit Score on Moneycontrol: Easily track your loans, get insights, and enjoy a ₹100 cashback on your first check!