Today I will explain about one of the most effective, but lesser researched, utilised and thus underrated indicator in trading i.e the Average Directional Index (ADX).
I said lesser researched because, a glance at the collection of books on technical analysis or trading online or offline will take you to volumes on RSI, MACD, Stochastic, Candlestick Patterns, and so on, but rarely would you find a book on ADX. Let us try and understand the significance of this indicator and why it should be an important tool in every trader’s arsenal.
The ADX indicator is primarily used to gauge the trend strength. It helps a trader understand how strong or weak the trend is and thus make a more educated guess pertaining to whether one should follow a trend following strategy or a sideways market strategy.
Active traders would well be aware that indicators like moving averages do wonderfully well in trending markets, but miserably fail in the sideways market. They fail to an extent that, all the money made in the trending market could very well be wiped out.
Also read: Nifty Next 50 or Nifty Midcap 150: Which is a better bet?
How often have you seen RSI (relative strength index) dancing in an overbought level in a strong uptrend for an extended period! Wouldn’t it be nice to understand the market environment first and use a strategy suitable to the prevailing market environment? That’s exactly where an indicator like ADX comes in handy. Before we get into the application, lets first have a look at the basic structure of an ADX indicator.
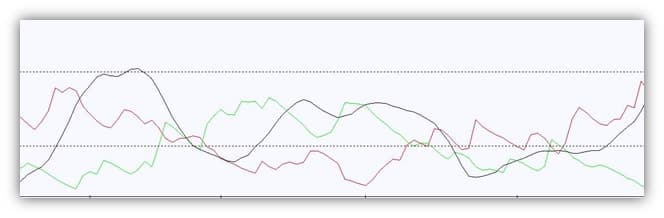 In the above picture, the black line is the ADX line, the green line is +DMI and the red line is – DMI. ADX is plotted as a single line with values ranging from a low of zero to a high of 100. Beginners find this indicator confusing to digest for one simple reason. All the traditional indicators give a sense of rising prices if it is moving up and falling prices if it is going down.
ADX, however, does not indicate the directional bias of the trend. i.e if the ADX line is sloping up, it simply tells you that the underlying trend (whichever direction it may be) is strong. Following exhibit will make this clear.
Exhibit 1 -
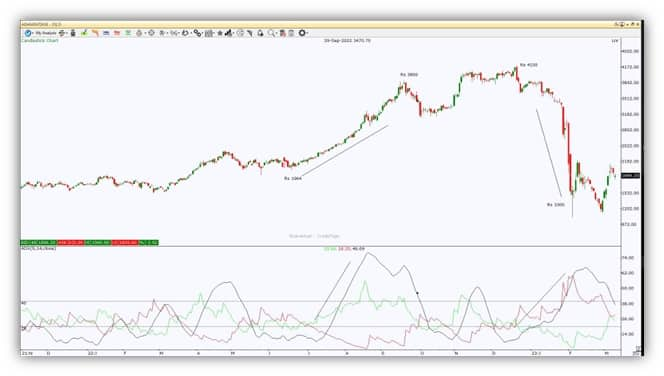 Adani Enterprises – Observe the black line (ADX line) sloping up while prices moving up on the left side. In the same chart, on the right side, observe the black line (ADX line) sloping up & prices moving down
ADX is formed by combining two other indicators which are positive directional indicator (abbreviated +DI) and negative directional indicator (abbreviated -DI). Positive Directional Indicator is calculated based on differences between current high and previous high over recent trading periods. Similarly Negative Directional Indicator is calculated based on differences between current low and previous low over certain recent trading periods.
Also read: Meet Dipak Gupta who will succeed Kotak as interim chief at Kotak Mahindra Bank
To put it simply, when the +DMI line is above the -DMI line, the trend is up and when the -DMI is above the +DMI, the trend is down. There are separate trading strategies which deal with buying and selling based on these +DMI and -DMI crossovers. However, we would consider it as a low probability game, mainly because these crossovers may prove to be futile when markets get stuck in a range.
Rather, a very effective way of using this indicator would be to observe the slope of ADX itself. Following are the broad guidelines for reading the ADX slope:
1) If ADX is crossing above 25 and importantly sloping up, the inference is, underlying trend has started to pick up steam. Although there is no sacrosanct number but generally this trend will start to mature on ADX crossing above 70. In layman terms, when the ADX is starting to move just above 25, a Trader would say the Car has fully filled tank and has enough petrol to move up. When ADX starts to move above 70, the momentum may be waning as the petrol levels would now be receding.
Also read: Over 100 small-caps make double-digit gains as indices scale fresh highs
2) If ADX is sloping down from above and moving below 25, the inference is the underlying trend is turning sideways. One would expect the stock to consolidate or remain range bound, all the way till ADX slips below 10 & starts sloping up again (Exhibit 2)
Exhibit 2
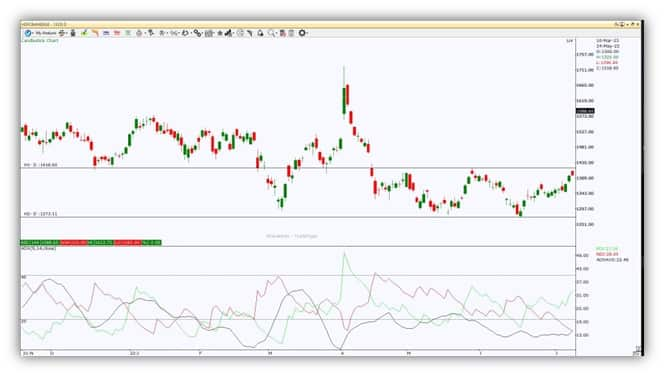
HDFC Bank – ADX sloping below 25, stock stuck in a sideways range
3) If prices are moving up, but the ADX slope instead of moving up, is moving down, it indicates a 'negative divergence' and the inference is, underlying uptrend is about to reverse sooner than later. (Exhibit 3)
Exhibit 3
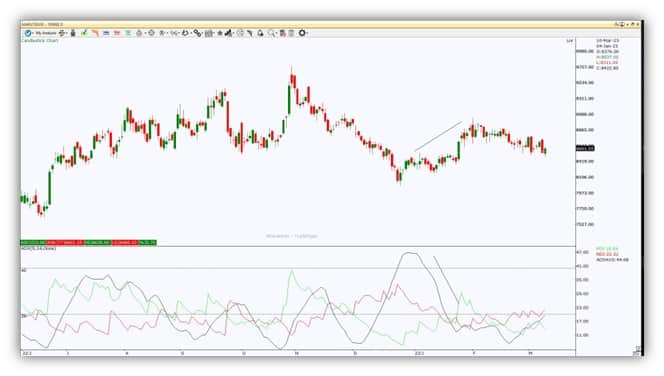 Maruti Suzuki – Recent example where the stock kept on moving up, without ADX support
Key Takeaways for Traders
a) Stocks having a rising ADX slope above 25 are expected to show strong trend strength. Use indicators & strategies suitable for trending markets like, Moving Average crossovers, Super Trend, Trend line support or resistance and avoid indicators and strategies of sideways markets like Bollinger Bands, RSI, stochastics, etc
b) Stocks having a falling ADX slope below 25 are expected to show weak/lacklusture or sideways movement. Use indicators and strategies suitable for sideways markets like Bollinger Bands, overbought and oversold RSI, Stochastics and avoid indicators and strategies of trending markets
c) If there is a clear cut divergence between price and ADX, look forward book profits before the trend start to reverse
d) Option Traders can focus on directional trading strategies when ADX slope is rising and gaining momentum, whereas non-directional trading strategies when ADX slope is moving down and trend is weakening.
This is how the ADX indicator can be a great tool for us to decipher the tread, stay tuned for more such insights.
Disclaimer: The views and investment tips expressed by investment experts on Moneycontrol.com are their own and not those of the website or its management. Moneycontrol.com advises users to check with certified experts before taking any investment decisions.

Check Free Credit Score on Moneycontrol: Easily track your loans, get insights, and enjoy a ₹100 cashback on your first check!