
Dear Reader,
Indian markets experienced a midweek scare as indices, having reached a new high, closed nearly 1.25 percent lower on Wednesday. Following its peak, the market saw a substantial four percent decline on the same day, with most stocks participating in the downturn. Despite expectations of a correction in the market, the abrupt fall caught everyone off guard. In a single day, the market incurred a staggering loss of Rs 9 lakh crore in market capitalisation.
Various factors, ranging from the spread of COVID to changes in margin norms by exchanges and collective profit booking by funds, were touted as reasons, but none could be substantiated. By the end of the day, reports indicated that cash selling by funds was moderate, adding an element of mystery to the crash.
Notably, the decline was confined to Indian markets, as global markets traded flat during the downturn in India. However, by late evening, even US markets began to experience a decline.
Fortunately, markets rebounded robustly on Thursday, concluding the week on a flat note with a modest decline of nearly 0.5 percent. Even more remarkable is that, despite the market downturn, foreign participants persisted in increasing their long positions in the derivative market. It is noteworthy that they simultaneously divested equities amounting to Rs 6,422.24 crore in the cash market.
Are The Technicals Indicating A Correction?
Nifty has given a negative weekly close after seven consecutive positive weekly closes and has formed a spinning top candlestick pattern, indicating indecisiveness. This can be an initial warning of a short-term correction provided there is follow-up selling in the coming week, and the Nifty breaks the low of the weekly candle, i.e. 20976. On the way down, 20DMA at 20831 will be an important support.
Closing below the 20DMA can lead to a slightly deeper correction, lasting for a few days or weeks.
The upside potential in the near term appears to be limited. The most optimistic scenario is that Nifty forms a distribution pattern, potentially reaching slightly higher levels from the recent peak but not significantly higher.
The decline observed on December 20th (Wednesday) caused the swing indicator to plummet to 8, marking an extremely oversold condition. Subsequently, Nifty rebounded as anticipated, recovering the swing indicator to 36 levels.
For the bullish momentum to persist, the Nifty must surpass the recent high of 21,593, potentially pushing the swing indicator back into the overbought territory around 80. However, if Nifty fails to breach the recent high and instead breaks the low of 20,976, the swing indicator may revert to oversold conditions, indicating a potential positive divergence before establishing a significant bottom in the short term.
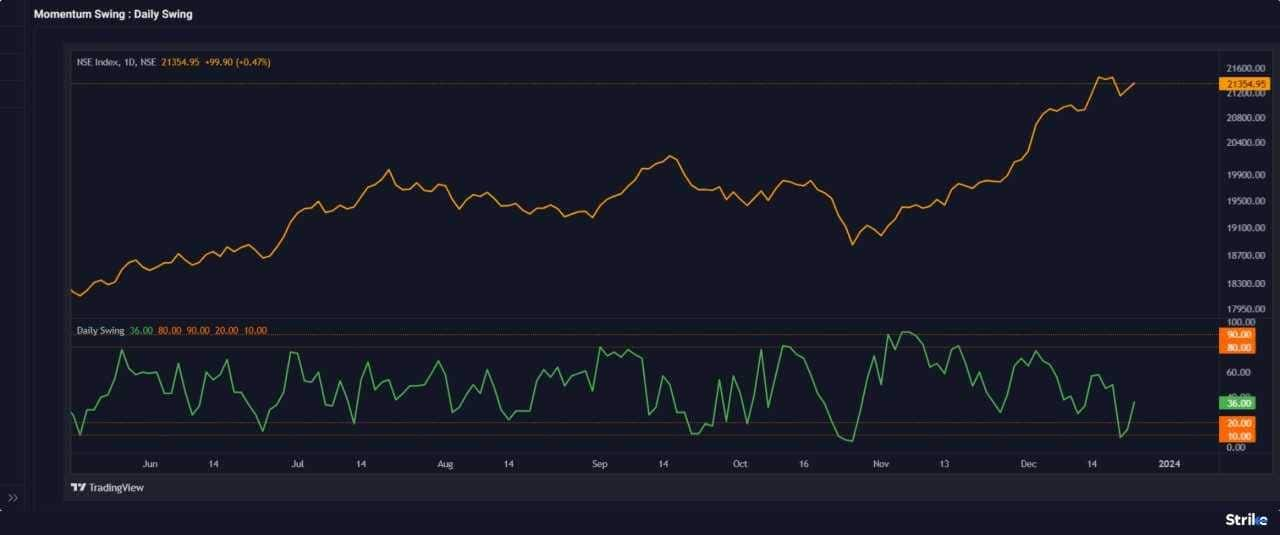
Source: web.strike.money
A surprising feature of the week was that despite a sharp fall, FIIs continued to add to their long bets in the market. FII's net long position in the index futures currently stands at 84,690 contracts and is in close proximity to the overbought levels (second red line) of 90,000 contracts.
Post 2020, the FIIs' net long positions in the index futures have peaked at 90,000–1,05,000 contracts. The highest long positions in the index futures by FIIs post-2020 were around 1,05,000 contracts in July 2023.
In the upcoming trading sessions, close attention should be paid to two critical factors. Firstly, the unwinding of long positions by Foreign Institutional Investors (FIIs) warrants careful monitoring. Secondly, a significant indicator is the potential price reversal in the Nifty index, specifically the break of the 20-day average at 20,831. If this level is breached concurrent with FIIs unwinding, it may signify a deeper correction or an extended period of consolidation.
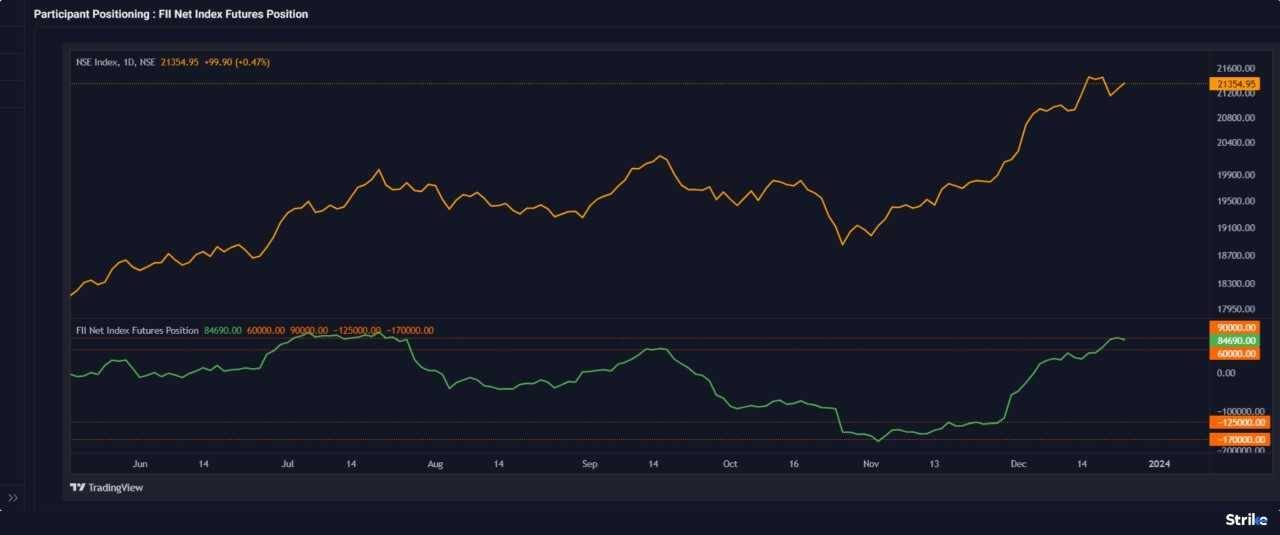 Source: web.strike.money
While the FIIs added to their long position, the clients' net short positions in the index futures have been the highest since 2017 and below the second red line. Typically, Nifty makes a short-term or a medium-term top when the short positions have reached this extreme, as seen in the chart below. Currently, it stands at 85,251 contracts. Before 2018, we have seen net short positions up to 2,90,000, but in the past five years, the index futures have been in the range of +1,55,000 to – 80,000 contracts.
We are at a crucial point with Nifty breaking below the 20DMA, i.e. 20831, which can possibly lead to a short-term or a medium-term correction.
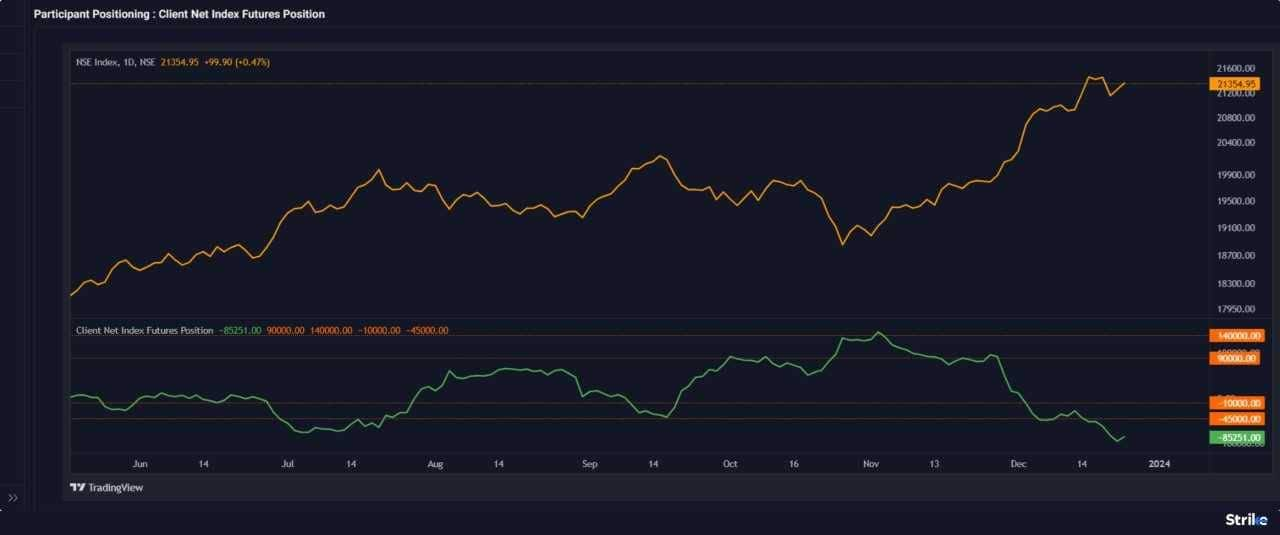
Source: web.strike.money
Options Data
Traders moved their positions as the market swayed. Starting the week, Put writers had a larger position, but by mid-week, Call writers had a commanding position. Thursday saw Put writers wrestle back their position. However, by the end of the week, the market is evenly poised, with Put writers having a slight edge, indicating a flat market.
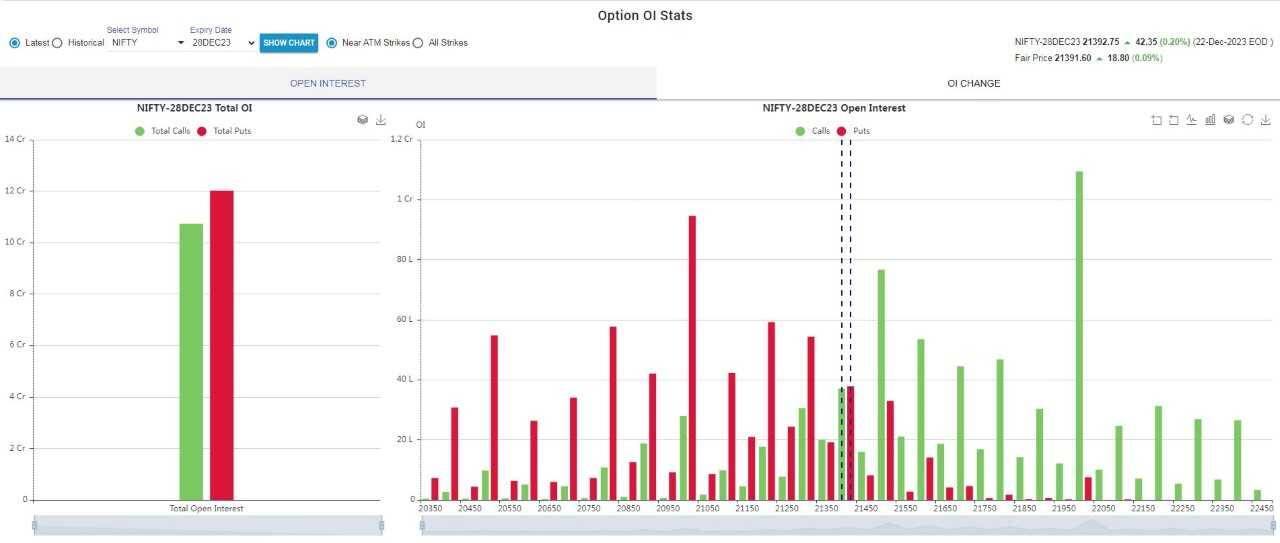
Source: Icharts.in
With the last settlement of the month and the year and foreign traders enjoying the year-end holidays, we can expect a flattish market on low volume.
Indices and Market Breadth
During the week, most indices touched a new high before receding. During the week, the BSE Sensex lost 0.52 percent while Nifty50 declined by 0.49 percent.
The new all-time high made by Sensex is 71,913.07, while that of Nifty is 21,593.
Smaller indices also touched new highs, but the sharp fall on Wednesday took the wind out of these stocks, resulting in a negative closing for the week.
The Nifty PSU Bank index was the worst performer during the week, falling by 3 per cent, the Media index was down 2 per cent, and the Auto index fell by 1.4 per cent. Nifty FMCG and Pharma indices closed the week in positive territory, gaining one percent each.
Among the top gainers in the week are PC Jewellers, which gained 59.35 per cent, Salasar Techno Engineering was up by 31.63 per cent, and Gallantt Ispat gained 28.06 per cent. Top losers were IIFL Finance, down 11.85 percent, Allcargo Gati, down 11.61 percent, and Sunteck Realty, which lost 9.81 percent during the week.
Global Markets
The US markets continued to go up, with all three US indices recording the eighth consecutive weekly gain. This is the longest weekly winning streak for the S&P 500 since late 2017. For the Nasdaq and the Dow, it marks the longest streak of consecutive weekly gains since 2019.
While Indian markets made new highs in the fourth quarter of 2023, the S&P 500 is within one percent of its all-time high in January 2022.
European markets were mixed, with pan-Euro Stoxx 600 closing marginally higher, though CAC, DAX and Italy’s MIB closed lower during the week. UK’s FTSE ended the week gaining 1.6 per cent, the most among leading European markets, as the UK’s retail inflation slowed more than expected.
Asian markets also were mixed during the week. Shanghai and Hang Seng traded in the negative while Nikkei closed in positive territory. The Chinese government’s restrictions in the gaming sector pulled its market lower.
Stocks To Watch
Among the frontline stocks showing strong momentum on the upside are Voltas, Hindustan Copper, HDFC AMC, MPhasis, Persistent, BEL and Wipro.
Stocks showing weakness are M&M, AB Capital, Apollo Tyres, City Union Bank, Dabur and Escorts.
Cheers,
Shishir Asthana

Check Free Credit Score on Moneycontrol: Easily track your loans, get insights, and enjoy a ₹100 cashback on your first check!


