By Rahul Ghose, Founder & CEO at Hedged
We are going to talk about a very effective but comparatively lesser-known technical indicator which can be used as a reliable gauge to ride the right side of the market. The indicator is Parabolic SAR (PSAR) and is primarily used to ride the trend in any asset class. Equally effective on all time frames, although, higher the time frame, better would be its dependability. Before we get into the trading strategies, time frames and applications on price charts in detail, let’s understand the basic background of this indicator.
About PSAR
Developed by J Wells Wilder, the indicator is named after its actual applicability to the trading instrument. For example, SAR stands for stop-and-reverse which essentially means, a trader riding the trend using PSAR will quickly reverse his position to the opposite side letting him always remain in the trade. The indicator is primarily used by traders to determine trend direction and potential reversals in prices.
Chart representation
Parabolic SAR indicator, widely available almost on all trading platforms as PSAR & appearing as a series of dots above or below the price line (be it stocks, commodities, currencies) depending on the direction in which the underlying is moving. A dot is placed below the price when it is trending upward and above the price when it is trending downward.
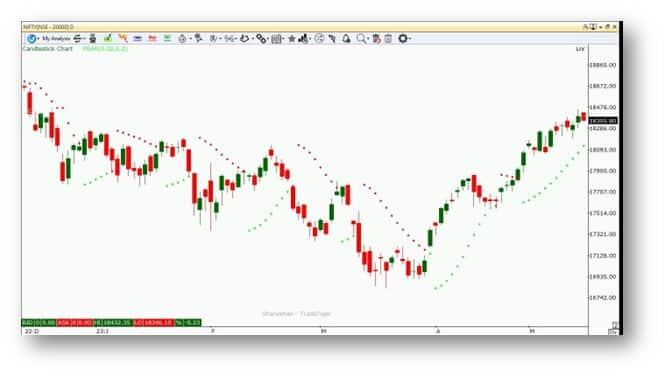
Exhibit 1 – Parabolic SAR on Nifty Daily time frame
Practical Application
Parabolic SAR can be effective -
1) As a buy / sell signal
2) As a trailing stop loss mechanism
3) Simply Understand trend bias -up/ down/sideways
Let’s understand the usages one by one -
1) As a buy/ sell signal - The PSAR indicator generates buy or sell signals when the position of the dots moves from one side of the price line to the other. For example, a buy signal occurs when the dots move from above the price to below the price, while a sell signal is generated when the dots move from below the price to above the price. The methodology will prove to be super effective if markets are trending with a strong trending bias.
However, it will be equally frustrating in range bound markets as the dots will continue to move up or down generating fake buy/sell signals making your broker, not you, rich! (refer picture below). To overcome this and make PSAR an effective weapon one can use multiple timeframe analysis or combine PSAR with any other technical tool to enhance the probability of success. More on this towards the end of this article.
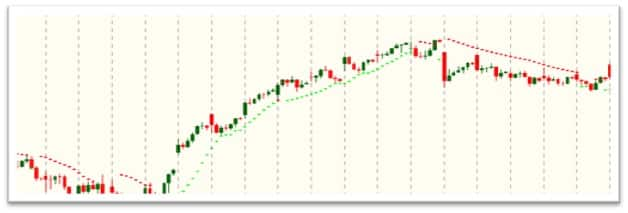
Exhibit 2 – Parabolic Sar in trending markets
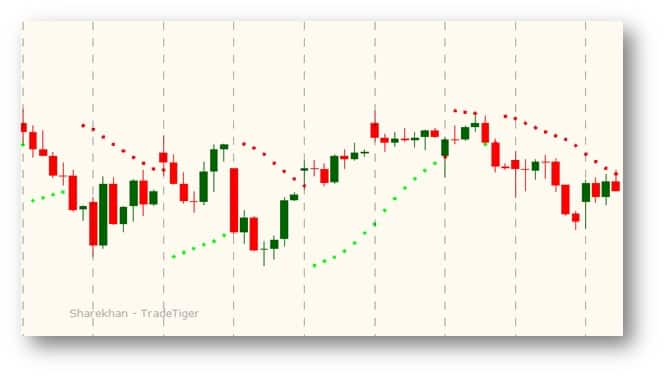
Exhibit 3 – Parabolic Sar in Sideways markets
2) As a trailing stop-loss mechanism - Almost all the traders can relate to the emotion where, when a trade starts to work in their favour, they exit on a slightest move fearing the security may move down again, only to see the underlying security going up manifold after their exit. PSAR can be an effective tool to keep such emotions at bay, as a trader can simply set himself a rule saying he will hold the long position as long as the price is above PSAR and short position as long as price is below the PSAR. (picture of an example). This, by the way, is the more popular way of using the indicator.
3) Understand Trend bias - This third use is more prominent and useful for options traders. Options traders can form a plethora of options strategies depending on their view of the underlying instrument. If the PSAR is pointing upwards, options traders can focus more on bullish options strategies. If PSAR is pointing downwards, options traders can focus more on bearish directional strategies, and lastly, if PSAR dots are continually moving up and down traders can plan non-directional strategies. Essentially, PSAR helps in forming a view which is of ultimate significance to options traders.
Trading strategy based on PSAR
As mentioned previously, using PSAR in isolation might work effectively in trending markets, but could equally frustrate traders in non - trending markets. For this reason, we have a simple trading strategy based on PSAR and one of the indicators we covered in our previous articles “ADX” (September 3, 2023).
ADX (average directional index) helps in gauging the strength of the trend, while Parabolic tries to gauge the trend bias. We compare the best of both worlds and will try to ascertain whether the trend bias shown by PSAR is reliable or not by gauging the strength of the trend using ADX.
For starters -
ADX stands for average directional index and helps in gauging strength trends. The slope of the ADX is more important than its absolute value. An ADX level of above 25 and rising slope tells us the potential for a strong uptrend in coming sessions. On the contrary, a falling ADX slope indicates that the trend is losing steam and a move below 25 suggests a more lacklustre/sideways market.
Let’s try and combine both in the following chart and understand our trade setup - the rules of the setup are as follows -
1) Decide on your trading time frame (intraday - 30 minutes swing - 60 minutes and positional - Daily)
2) Plot PSAR on price chart and observe the current price action - up/ down / neutral
3) If prices are below the PSAR level, wait for them to cross the PSAR levels and ADX slope to rise above 25
4) On the contrary if trend reverses on PSAR but ADX slope is pointing downwards, ignore the trade setup
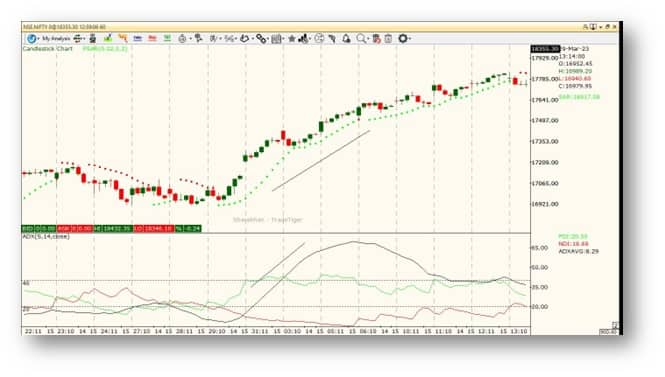
Exhibit 4 – A classic buy setup where prices moved above PSAR & ADX started sloping up at the same time
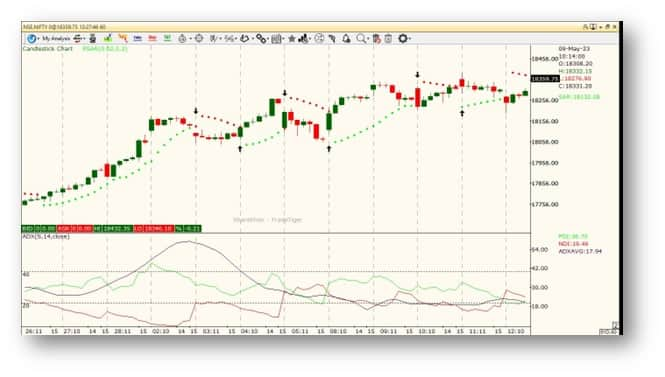
Exhibit 5 – Prices kept on moving above & below PSAR, but falling ADX & flat slope prevented us form initiating any trades
This simple trade setup helps in avoiding a lot of fake signals and would make the indicator more useful.
Disclaimer: The views and investment tips expressed by investment experts on Moneycontrol.com are their own and not those of the website or its management. Moneycontrol.com advises users to check with certified experts before taking any investment decisions.

Check Free Credit Score on Moneycontrol: Easily track your loans, get insights, and enjoy a ₹100 cashback on your first check!